Fraud Waves & Seasons
March 7, 2025
Fraud does not always move in a straight line. It comes in patterns, surges, and slowdowns that become easier to recognize over time. As investigators, we often feel these spikes before we can fully explain them. Suddenly, cases pile up, teams scramble, and it becomes an all hands on deck moment.
That is why I think of fraud like weather. There are seasons, cycles, and unexpected shifts. Some months feel quiet. Others feel like the sky opened up and started raining scam reports from every direction.
Looking at Fraud Like Seasons
Trends and patterns are built into almost everything, and fraudulent activity is no exception. Over time, those patterns begin to form a broader picture. If you pay attention long enough, you start to notice when fraudsters seem to slow down, regroup, and then come back with force.
Comparing fraud to weather may sound metaphorical, but the pattern fits surprisingly well. Just like the calendar gives us cold winters, mild springs, hot summers, and changing falls, fraud has cycles of its own. Of course, just like weather, it can still surprise us. A summer can feel cold, and a winter can feel warm. Fraud can do the same thing by shifting volume and tactics when people least expect it.
These shifts matter because they can help us spot when bad actors are pausing, adapting, or refining their methods before the next surge.
A Simple Look at 2023 Fraud Reports
To illustrate the idea, this example uses publicly available fraud data from 2023. The FTC reported 2.6 million fraud cases that year, and this simplified monthly breakdown helps visualize how reports tend to rise and fall over the course of a year.
The first chart shows the year in normal order, month by month.
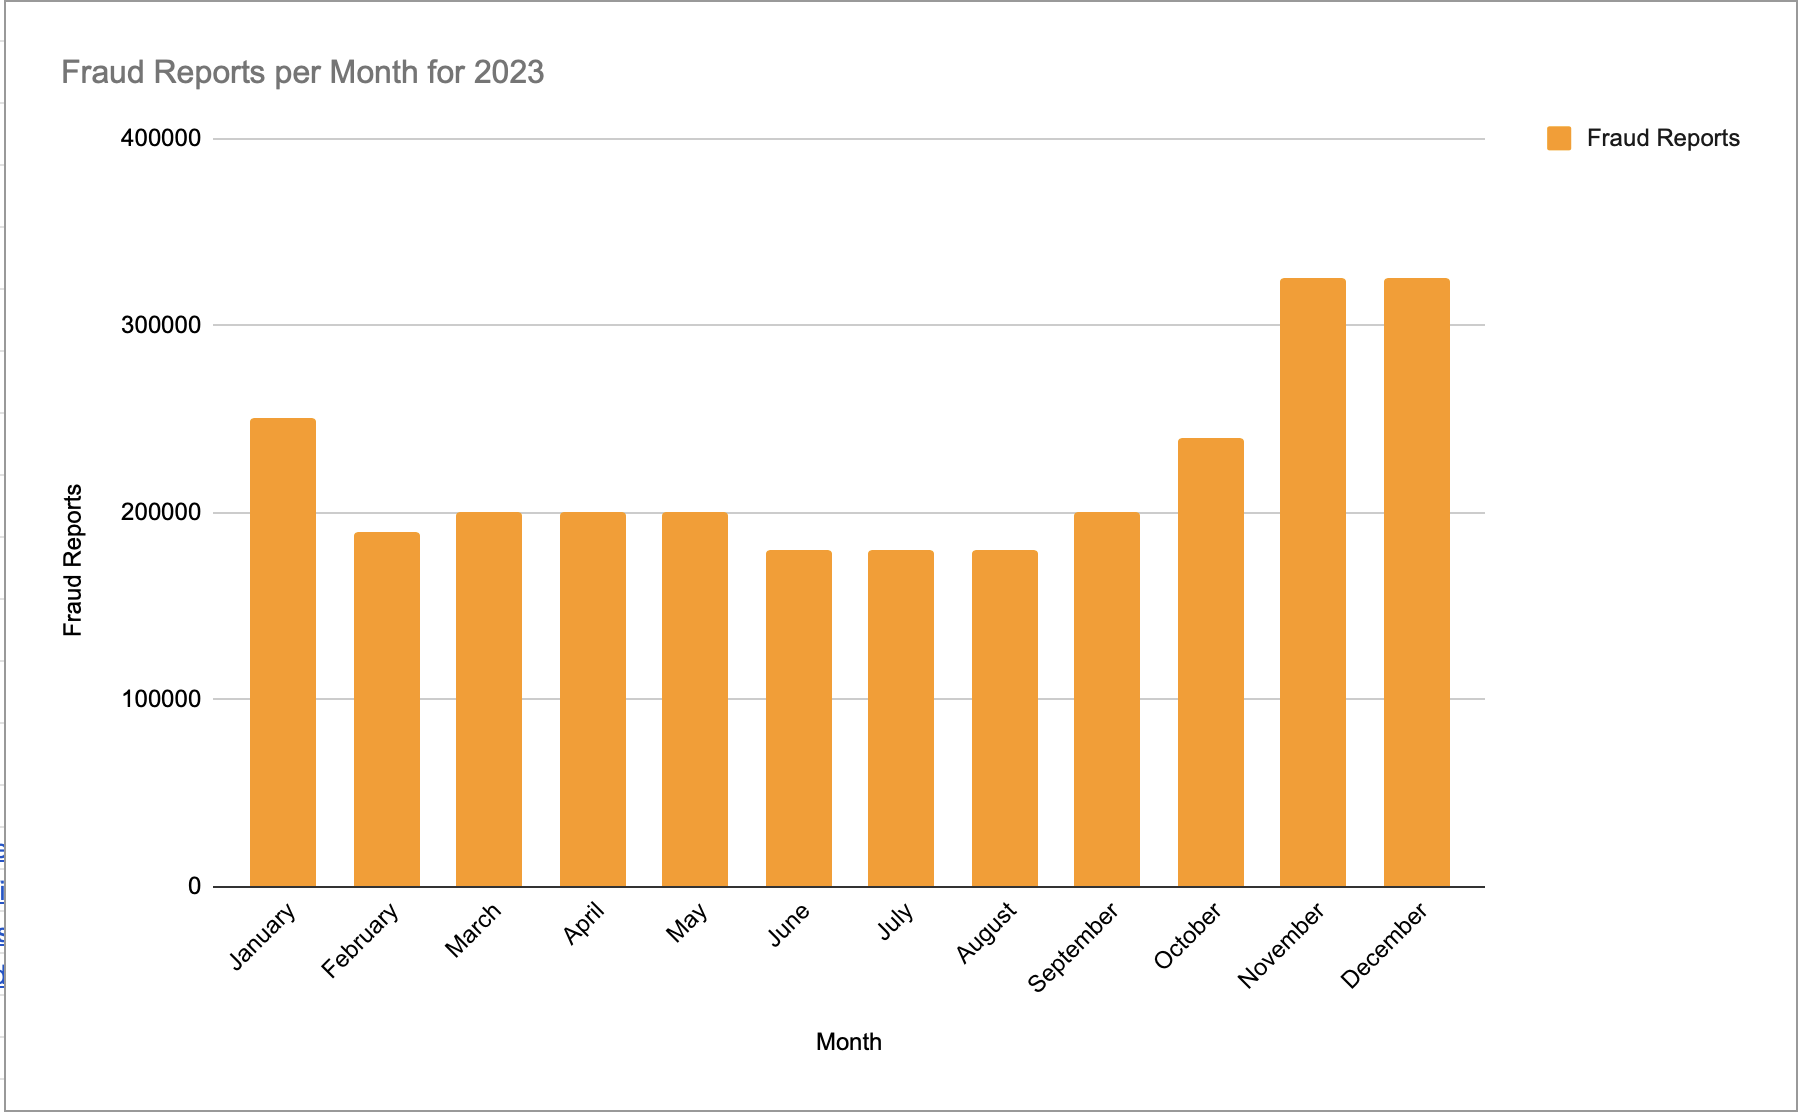
In this view, fraudulent activity appears to slow in the summer, rise in the fall, peak during winter, and then ease off in the spring. That pattern feels familiar to many investigators because it tends to repeat itself across years and industries.
Turning the Pattern Into a Wave
Now here is where it gets interesting. If you split the year in half and reverse the monthly order, the same data starts to look less like a routine timeline and more like a wave.
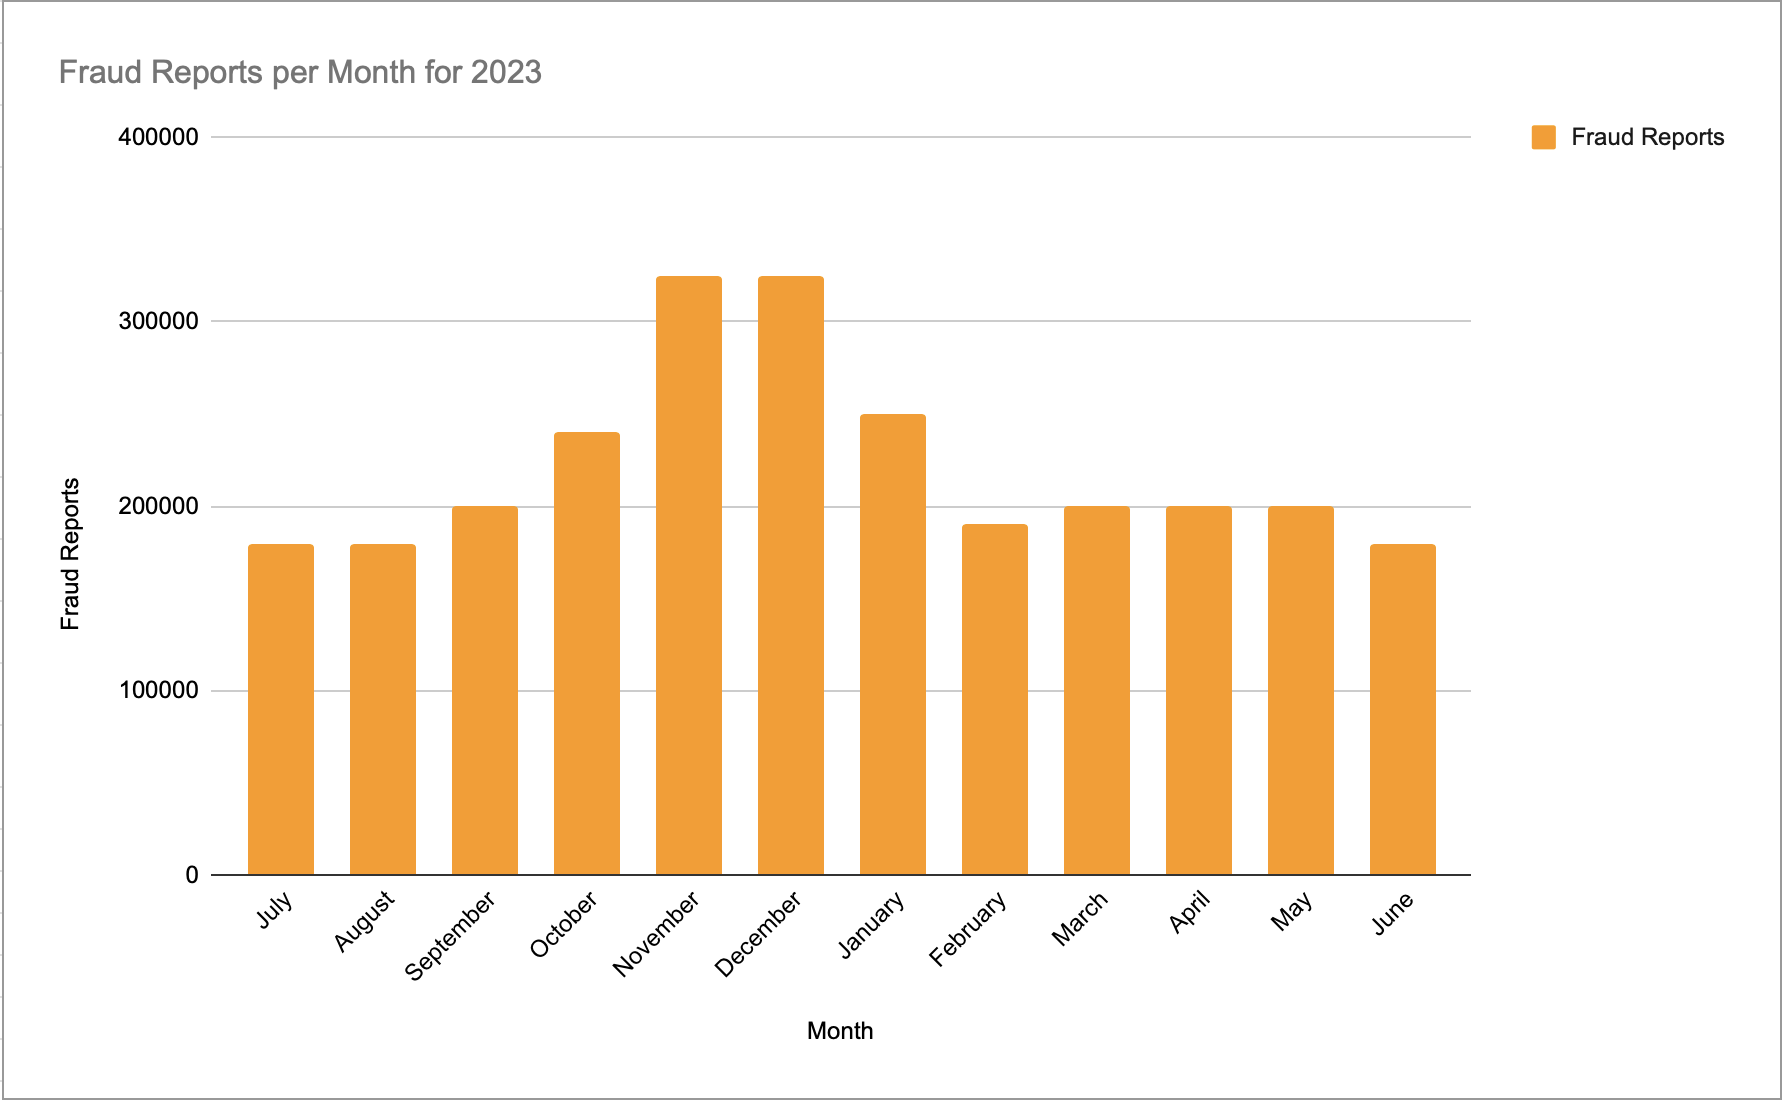
This perspective resembles a wave, which explains why fraud often feels like it arrives in surges.
On a day to day level, those larger movements can be hard to see. But when the data is viewed over time, the wave becomes much clearer. And this is using only public information. Inside a company, internal fraud metrics could reveal even deeper sub trends, outliers, and patterns that public reporting alone cannot fully show.
Why This Matters for Investigators and Organizations
Understanding fraud cycles gives us an advantage. If we know high risk periods are likely coming, such as during the holiday season, we can prepare investigations more effectively, allocate resources earlier, and reduce strain on the people responding to the surge.
In other words, just as people prepare for a harsh winter, organizations can prepare for predictable spikes in fraud. That kind of planning can make chaotic periods far more manageable for investigators, analysts, and the people they serve.
Final Takeaway
Fraud may look chaotic on the surface, but that does not mean it is patternless. The more closely we study its cycles, the better we can anticipate pressure points and respond with intention instead of panic.
Fraud comes in waves. And the better we understand the tide, the better prepared we are to meet it.
The goal is not just to react to fraud when it spikes. The goal is to be ready before the wave hits.
Sources
- FTC, Nationwide Fraud Losses Top $10 Billion in 2023
- FTC Consumer Sentinel Infographic
- PaymentsJournal, Seasons of Fraud
- TransUnion, Digital Holiday Fraud in 2023
Sources
- https://www.ftc.gov/news-events/news/press-releases/2024/02/nationwide-fraud-losses-top-10-billion-2023-ftc-steps-efforts-protect-public
- https://public.tableau.com/app/profile/federal.trade.commission/viz/ConsumerSentinel/Infographic
- https://www.paymentsjournal.com/seasons-of-fraud-how-fraud-patterns-shift-throughout-the-year/
- https://newsroom.transunion.com/digital-holiday-fraud-in-2023/